Enough with the in-depth boring stuff. Let’s do something fun with Adalight!
Aside from the relatively straight-forward color data, each Adalight frame is preceded by a small six-byte header. Since this header data is mixed in with a lot of RGB color data, I got to thinking… if this data was pushed to the LEDs, what would it look like?
Meet ‘Ada’
The Adalight protocol’s header is composed of six bytes and split into two distinct parts: the magic word and the checksum.
The first part, the “magic word”, is a three-byte phrase that marks the start of every frame. For Adalight, in traditional Lady Ada fashion, the magic word is “Ada”:
| Letter | ASCII | Hexadecimal | Binary |
|---|---|---|---|
| A | 65 | 0x41 | 01000001 |
| d | 100 | 0x64 | 01100100 |
| a | 97 | 0x61 | 01100001 |
This is a constant word, which makes it easy to visualize. So let’s make it a color!

This is Ada! This is the characters ‘A’ ‘d’ ‘a’ in ASCII converted to decimal and mapped to red, green, and blue. That’s RGB 65 / 100 / 97 in decimal, or 0x416461 in hex.
Here’s a full dossier on the color from ColorHexa, who describes it as “very dark desaturated cyan”. Neat!
Checksum Possibilities
The second part of the 6-byte header is the checksum. The Adalight checksum exists to verify that any “Ada” found by the microcontroller is valid. It’s also 3 bytes, and follows the following formulas:
hi = (numLeds << 8) & 0xFF;
lo = numLeds & 0xFF;
checksum = hi ^ lo ^ 0x55
Where:
- numLeds is a 16-bit integer value for the number of LEDs in the frame data packet, -1 (the number of LEDs is always greater than 0). This value makes up the first two bytes of the checksum:
- hi is the 16-bit portion of the number of LEDs.
- lo is the 8-bit portion of the number of LEDs.
- checksum is the actual check value. The hi LED count is matched with a bitwise XOR against the lo LED count, the result of which is matched with a bitwise XOR against 0x55 (in binary: 01010101).
The checksum is recalculated on the Arduino based on the transmitted number of LEDs, and if it matches the received checksum Adalight will switch into its data parsing mode. If the checksum byte does not match, the code starts the header search again.
If everything is working properly, the checksum should be constant for a given number of LEDs. But because the LED count is a 16-bit integer, there are 216 possible checksums. That is 65,536 3-byte combinations!
Visualizing Checksums
Obviously I’m not going to make 65,536 single-color photos like ‘Ada’ above. So how about in place of whole photos, we instead use individual pixels?
Because we have 216 checksum values, we can make a nice square image that is 28 by 28 pixels large – or 256 by 256. I built a spreadsheet of all possible checksums using Excel and the formulas above, and exported the data into a comma-separated values (CSV) file – a universal format for spreadsheet data.
I then wrote a short script for Processing 3, which is a language / IDE that was designed to teach programming to non-programmers by using visual feedback. It’s a powerful tool though, and it includes all of the methods needed to create images from CSV files.
Want to see the results?
Complete Checksum
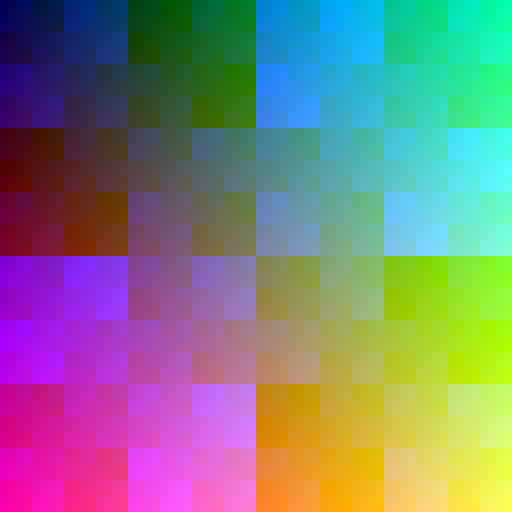
Holy cow that looks cool.
This image shows the complete checksum: hi byte, lo byte, and the check value – mapped to red, green, and blue, respectively.
256×256 is pretty small, so I blew up these images to 512×512 in Photoshop using nearest neighbor, which should preserve the pixel patterns.
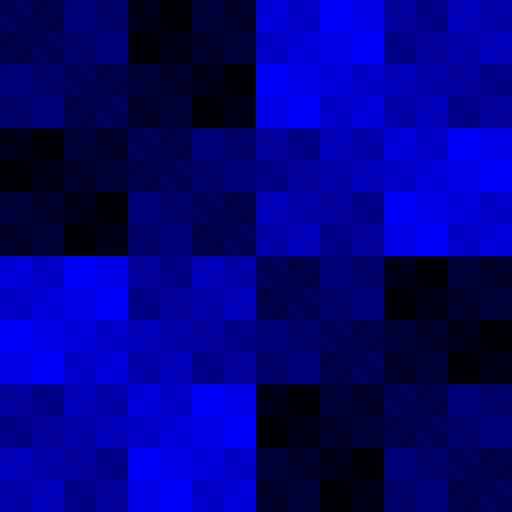
LED Count
As they say, a picture is worth a thousand words:


From left to right, this is the high byte for the LED count (red channel), the low byte for the LED count (green channel), and the combined image (red + green).
A nice benefit of the square 256×256 size is that with a 16-bit LED count the variables follow the boundaries of the image window. So the low LED count increases from left to right, and when it rolls over at the edge of the frame it increments the high LED count. This gives us smooth 8-bit gradients – from left-to-right for the low byte, and top-to-bottom for the high byte. Combining the two gives us a multicolored diagonal gradient.
The WordPress resizing creates some banding in these images. Click each to see the full-sized image.
Check Value
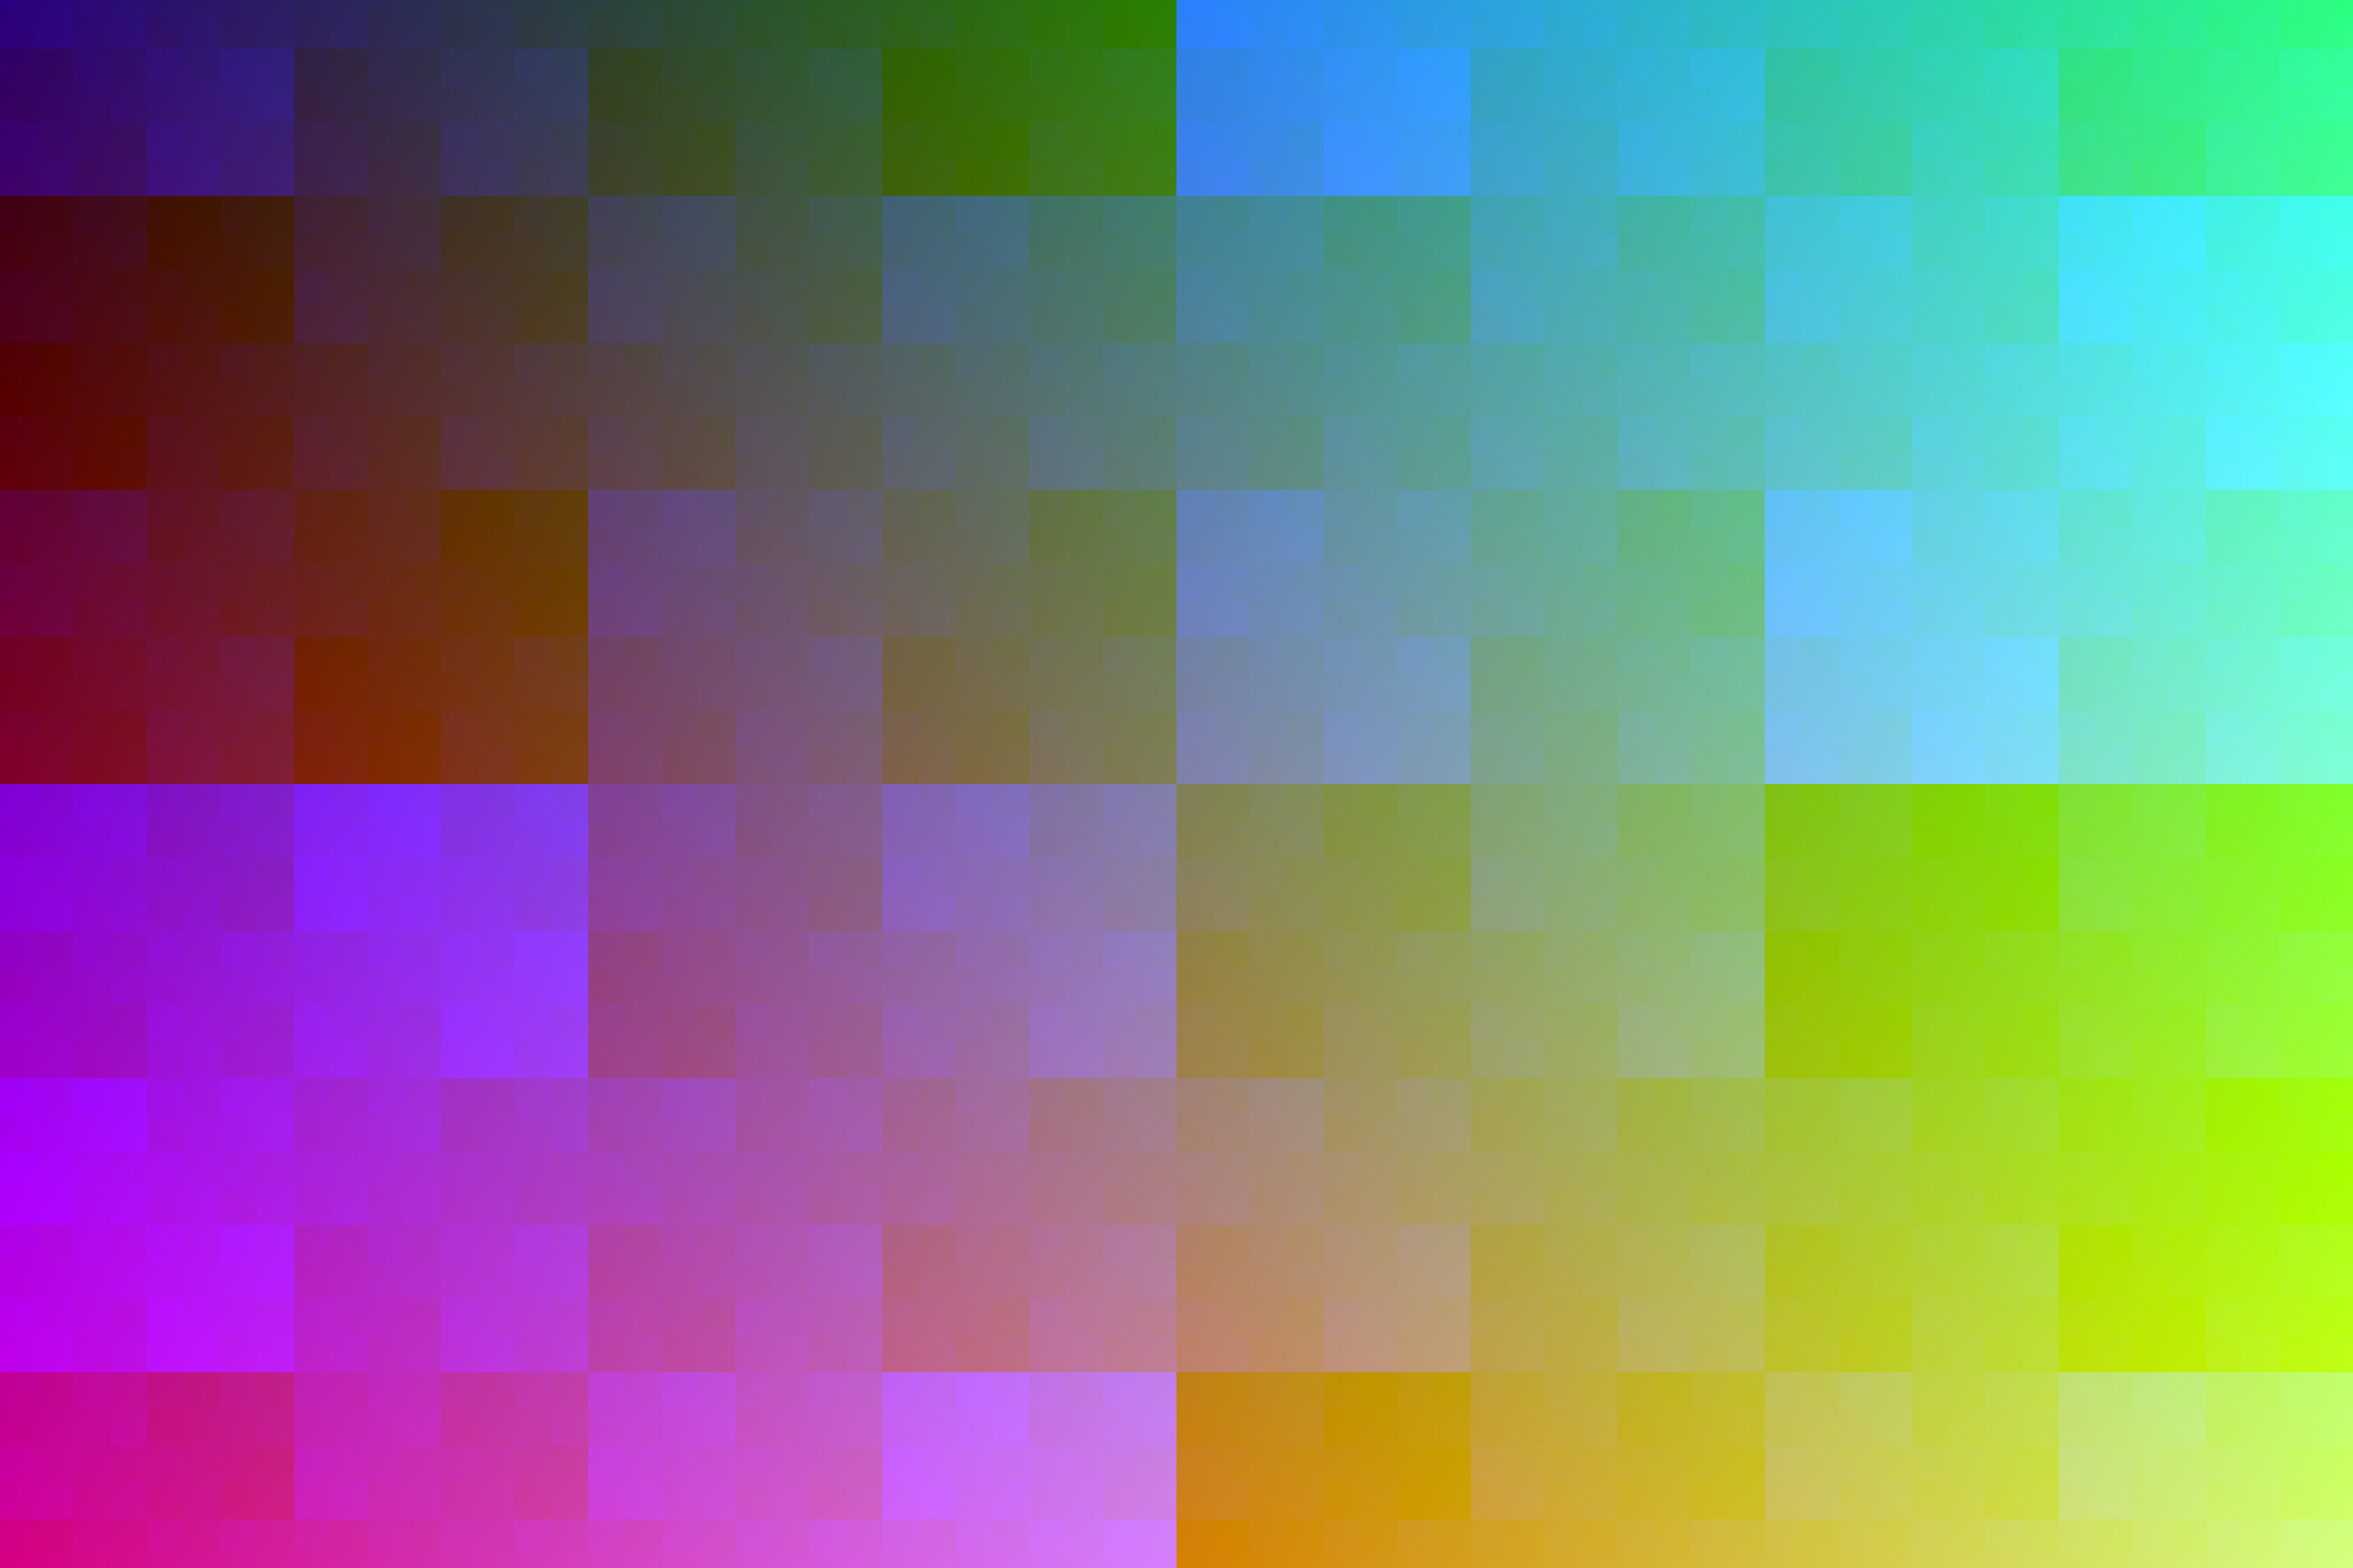
Now we can add in the check value!
This looks really cool. You can see that there are eight ‘steps’ both horizontally and vertically, that almost look like video compression macroblocks. These blocks align with the bit changes from the bitwise XOR operations. But there is this strange fractal-esque quality throughout the whole thing that’s quite mesmerizing…
Visualizing the Entire Header
We can take this one step further to visualize the entire header, by inserting one ‘Ada’ pixel before each ‘checksum’ pixel. We’ll also need to stretch the image horizontally, to account for doubling the number of pixels we need to fit.

Not quite as pretty as the checksum on its own, but still interesting! Any left-right pair of pixels in this image starting with an ‘Ada’ color is a valid header for Adalight.
Phase Shift
Of course, all of the above visualizations assume that the color data is in phase. Meaning that if you assign three data bytes to a color, they line up in the order of the color channels: red, then green, then blue. But it’s just as likely that these headers could be pushed to the LEDs out of phase, meaning that instead of starting on red they start on green or blue.
Because the patterns are the same, the visualizations don’t change much. You can take all of the same visualizations and shift the hue +120° to get the phase-shifted versions. Alternately, you could use the same Processing sketch and simply change the byte order. But since the patterns stay the same these aren’t interesting enough to include.
Conclusion
Seeing a visual representation of the data is always interesting, and can help you see some of the patterns. These specific visualizations aren’t very useful, but they are cool to look at. The idea of these visualizations was itching at my brain, and I’m glad I spent the time to put them together!
I think that’s it for ambilight posts for awhile. Keep an eye out for some of the other projects coming up!
Processing Sketches
In case it’s useful to anyone, here is the code I used to create these visualizations with Processing 3.3.3. Feel free to repurpose these for your own needs:
Checksum
/*
 * Adalight Checksum Visualization
 * www.partsnotincluded.com
*/

Table table;

void setup(){
  size(256, 256);
  loadPixels();

  table = loadTable("AdalightChecksums.csv", "header");
  int numRows = table.getRowCount();

  for(int i = 0; i< numRows; i++){
    TableRow row = table.getRow(i);
    int r = row.getInt("LED Size Hi");
    int g = row.getInt("LED Size Lo");
    int b = row.getInt("Check");

    color c = color(r, g, b);
    pixels[i] = c;
  }
  updatePixels();
  save("Ada_Checksums.tif");
}
Complete Header
/*
 * Adalight Header Visualization
 * www.partsnotincluded.com
*/

Table table;

void setup(){
  size(512, 256);
  loadPixels();

  table = loadTable("AdalightChecksums.csv", "header");
  int numRows = table.getRowCount();

  int index = 0;

  for(int i = 0; i< numRows; i++){
    TableRow row = table.getRow(i);
    int r = row.getInt("LED Size Hi");
    int g = row.getInt("LED Size Lo");
    int b = row.getInt("Check");

    color c = color(r, g, b);
    pixels[index++] = color('A', 'd', 'a');
    pixels[index++] = c;
  }
  updatePixels();
  save("Ada_Header.tif");
}